This article is about monitoring some IoT devices (e.g. a CO2 sensor) with a combination of Mosquitto (a MQTT broker), Telegraf (a metric collector), InfluxDB (a time-series database) and Grafana (for displaying everything nicely). All mentioned services should run on a server that can be reached from the monitoring device(s) and your PC where you want to check the data. We will use MASH (see below) to deploy the services.
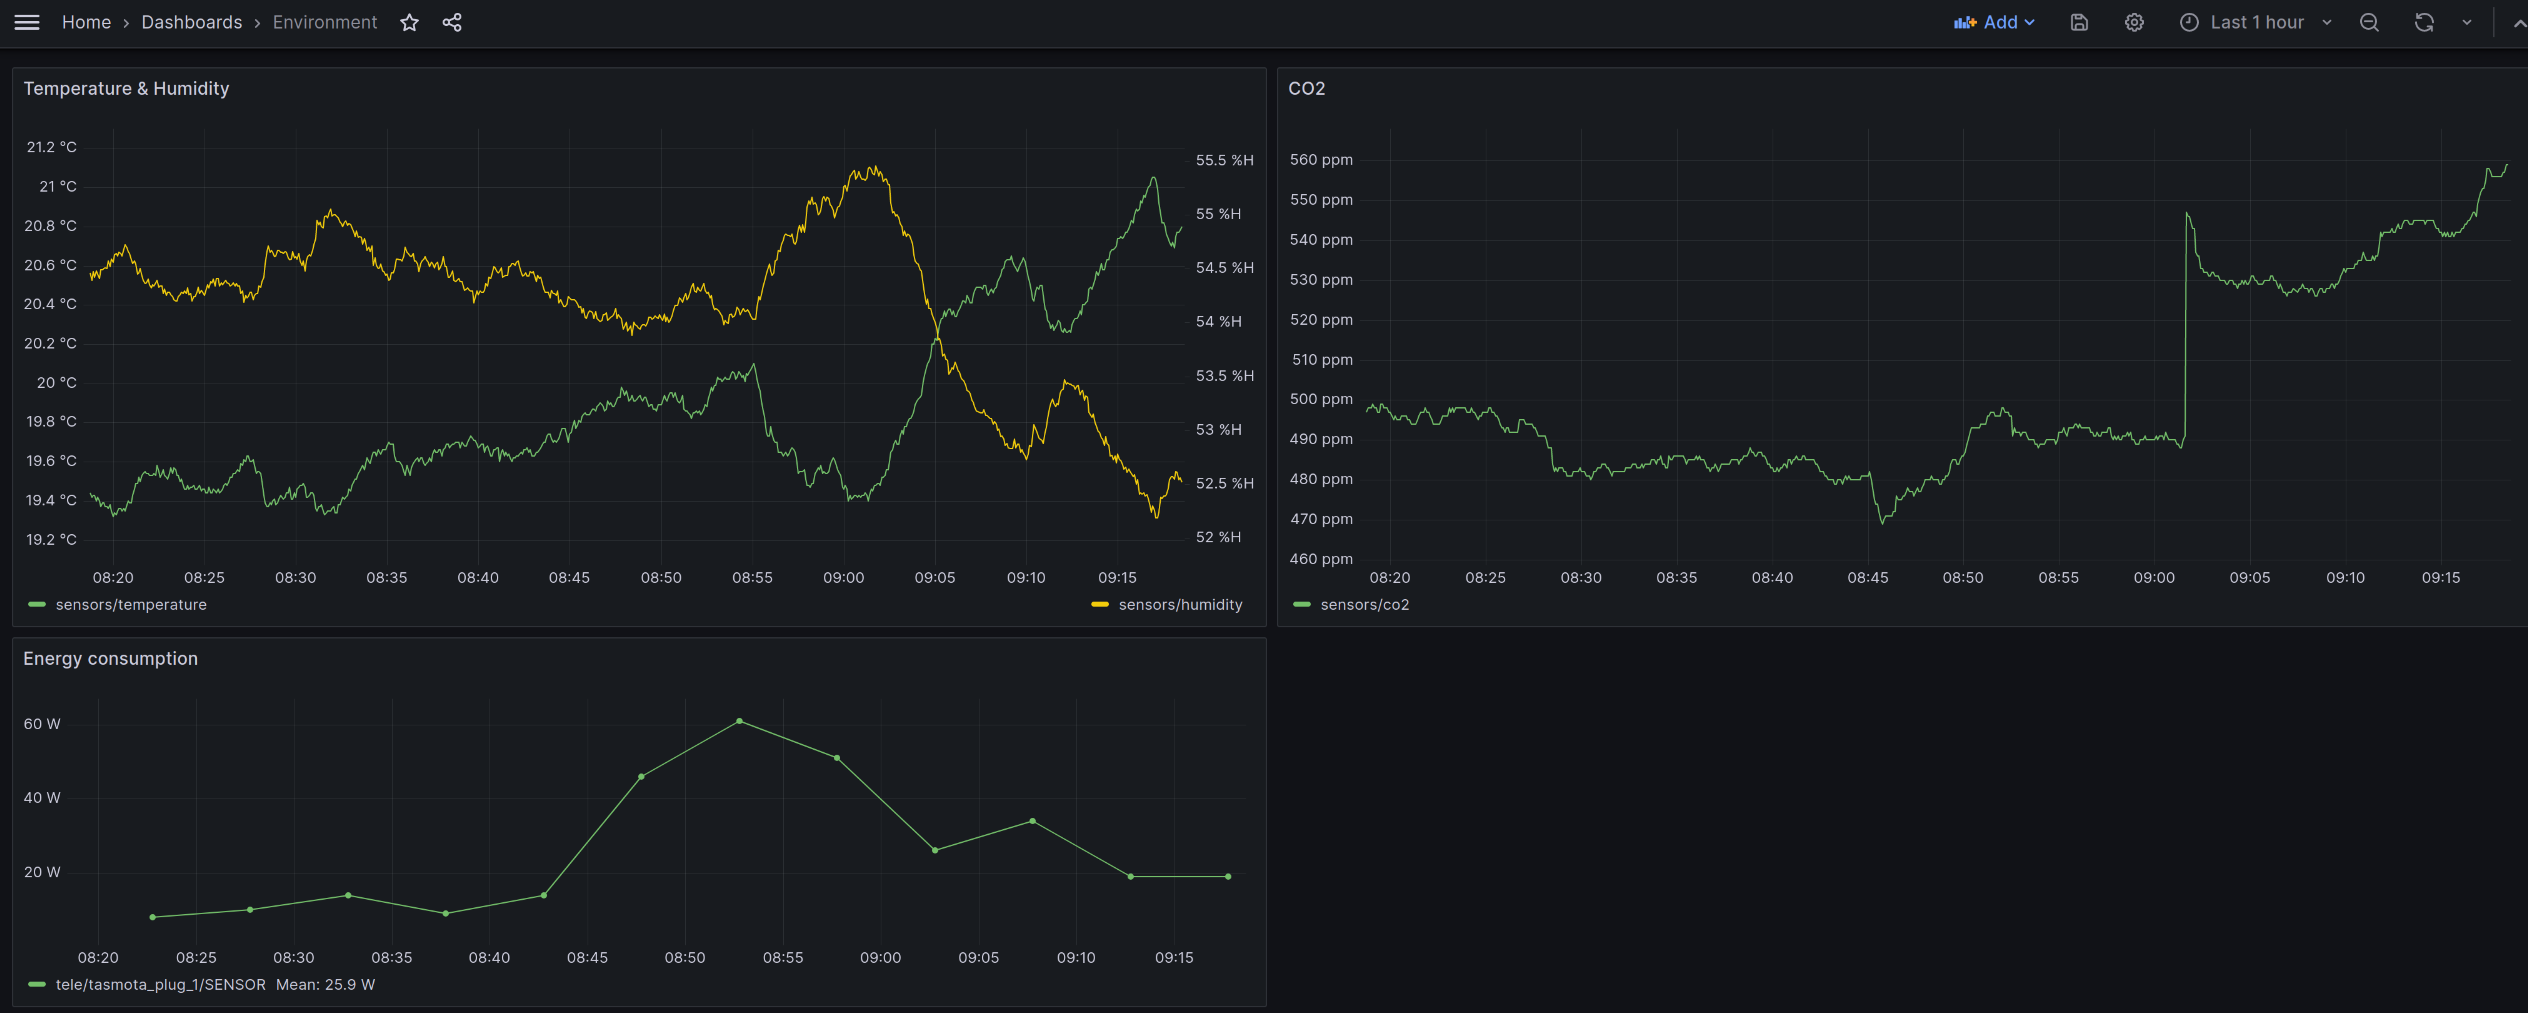
In the end this will enable you to get to something like this:
While writing, I decided to split this into two parts. Part 1 will set up our server infrastructure, Part 2 will show how to integrate some real sensors.
Let’s get started with Part 1 and answer:
What is MASH?
MASH is short for “Mother of all self-hosting”. It’s a collection of ansible roles, tied together by a playbook that can help deploy and maintain a large number of services. It was inspired by the matrix-docker-ansible-deploy follows the same philosophy and is maintained partly by the same people.
MASH includes services like
- Nextcloud
- Authentik
- Gitea
- Peertube
- Funkwhale
and more than 50 others at time of writing this blogpost (List of all supported services).
The motivation for this playbook is to have all services run in docker, be as configurable as possible, while maintaining easy upgrades and reproducible deployments. The documentation IMHO is very good, so if people are willing to use ansible this might be a lot easier than writing roles themself.
Architecture
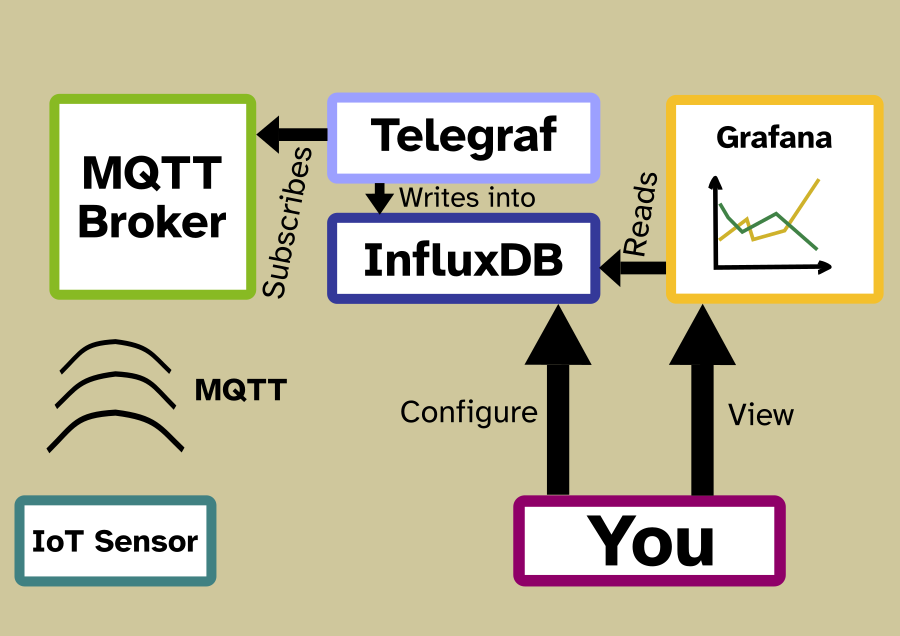
In the end we will have a IoT device that sends data to a MQTT topic on the MQTT broker Mosquitto. Telegraf will listen to this topic and write this into InfluxDB. When you want to have a look at the data, you can access Grafan which will query InfluxDB.
Prerequisits
To have everything it needs to use MASH you should ensure the following things are done and working
Configure DNS
By following this guide we will set up some services which will be reachable from via web interface (Grafana and InfluxDB) while others will not (Telegraf, Mosquitto). We will set a domain name for the server itself, one for Grafana and one for InfluxDB. This allows you to move services more easily. Feel free to adjust the setup to your needs (but don’t forget to change tha _hostname variables accordingly later).
| Service | Domain | Type | Target |
|---|---|---|---|
| Server general | s0.example.com | A | <IPv4-IP> |
| Server general | s0.example.com | AAAA | <IPv6-IP> |
| Grafana | grafana.example.com | CNAME | s0.example.com |
| InfluxDB | influxdb.example.com | CNAME | s0.example.com |
Set up the services
Setting up the services will require three steps. The first will set up the general server with Mosquitto and Influxdb. Then we configure mosquitto and influxdb and use this to set up Telegraf and Grafana.
Setting up the basis, Mosquitto and InfluxDB
Setting up will be based on one configuration file of the playbook. <your-domain> is the one you set up as Server General (s0.example.com).
Execute the following these steps inside the playbook directory:
create a directory to hold your configuration (
mkdir -p inventory/host_vars/<your-domain>)copy the sample configuration file (
cp examples/vars.yml inventory/host_vars/<your-domain>/vars.yml)copy the sample inventory hosts file (
cp examples/hosts inventory/hosts)edit the inventory hosts file (
inventory/hosts) to your liking
Now you are ready to modify the main configuration file atinventory/host_vars/<your-domain>/vars.yml.
Add the following to your playbook and replace the default values (IN_CAPS)
############
## Basics ##
############


# Put a strong secret below, generated with `pwgen -s 64 1` or in another way
# Various other secrets will be derived from this secret automatically.
mash_playbook_generic_secret_key: ''

mash_playbook_docker_installation_enabled: true
devture_docker_sdk_for_python_installation_enabled: true

# To ensure the server's clock is synchronized (using systemd-timesyncd/ntpd),
# we enable the timesync service.

devture_timesync_installation_enabled: true


#############
## traefik ##
#############

# Traefik will be our revers proxy that makes grafana and influxdb accessible from the outside. It will automatically obtain SSL certificates for us

mash_playbook_reverse_proxy_type: playbook-managed-traefik
# The E-Mail address that traefik will use to obtain certificates with
devture_traefik_config_certificatesResolvers_acme_email: certs@example.com

##############
## influxdb ##
##############
influxdb_enabled: true
influxdb_hostname: influxdb.example.com

influxdb_init: true
influxdb_init_username: "USERNAME"
influxdb_init_password: "SECURE-PASSWORD"
influxdb_init_org: "YOUR-ORG"
influxdb_init_bucket: "monitoring"


#################
## Mosquitto   ##
#################

mosquitto_enabled: true
Installing
Before installing and each time you update the playbook in the future, you will need to update the Ansible roles in this playbook by running just roles. just roles is a shortcut to download the latest Ansible roles. If you don’t have just, you can also manually run the roles commands seen in the justfile (this gets tedious fast).
To install you should can just install-all. That’s it.
Congratulations! You installed your first services and can now visit influxdb.example.com and login with the credentials you set above!
Configuring Mosquitto and InfluxDB
Mosquitto
To configure mosquitto you only need to set up users. I would recommend to set up seperate users for telegraf and your IoT devices as you might want to restrict the IoT users permissions (not covered here).
Setting up mosquitto users can be done just run-tags mosquitto-add-user --extra-vars=username=<username> --extra-vars=password=<password>. For the setting to take effect, you must restart the container. To do that you can use just start-group mosquitto.
InfluxDB
Log in on influxdb.example.com with the credentials you configured in your vars.yml.
We will now create a configuration that will automatically be read by telegraf.
Got to Load Data -> Telegraf and press Create configuration. Choose the bucket monitoring and search for the MQTT consumer as data source.
Add the following replace the [[inputs.mqtt_consumer]] with the following configuration (and make sure that you replace the example values).
[[inputs.mqtt_consumer]]
  servers = ["tcp://s0.example.com:1883"]

  ## Topics that will be subscribed to.
  topics = [
    "sensors/#",
  ]
  data_format = "value"
  data_type = "float"
  username = "USERNAME_SET_WHEN_CONFIGURING_MOSQUITTO"
  password = "PASSWORD_SET_WHEN_CONFIGURING_MOSQUITTO"
Now got to Setup Instructions and copy the INFLUX_TOKEN. It will only show once! Also copy the config URL. You will need both in the following step.
Setting up Telegraf and Grafana
You now have everything for the last step: Setting up Telegraf and grafana. We did not do this in the first step as wee needed the access tokes/configuration link which we have now. Therefore you should now add two new sections to your vars.yml.
##############
## telegraf ##
##############
telegraf_enabled: true
telegraf_influx_token: TOKEN-YOU-GOT-FROM-INFLUX
telegraf_config_link: https://influxdb.example.com/api/v2/telegrafs/0b6d11ca6bb1b000

#############
## grafana ##
#############

grafana_enabled: true
grafana_hostname: grafana.example.com
grafana_default_admin_user: USERNAME
grafana_default_admin_password: 'SECURE-PASSWORD'

grafana_provisioning_datasources:
  - name: InfluxDBs3
    type: influxdb
    access: proxy
    url: "https://{{ influxdb_hostname }}"
    jsonData:
      version: Flux
      organization: YOUR-ORG
      defaultBucket: monitoring
    secureJsonData:
      token: "TOKEN-YOU-GOT-FROM-INFLUXDB"
After that, once again do just install-all. You should now have a working setup of all services. Now
Let’s put some data in and display it
To send some data that you can display you can use the following python script. Save it as cli.py
import argparse
import paho.mqtt.client as mqtt
import random
import numpy as np
import time


def gen_time():
    return time.strftime("%H:%M:%S", time.localtime())


def gen_temp():
    """
    amplitude: amplitude of temperature changes
    mean: mean of the simulated temperature
    offset: offset of the signal in seconds
    period: periond time in seconds
    """
    amplitude = 5
    mean = 20
    offset = 0
    period = 900
    temp = np.sin((time.time() + offset) % (period) * 2 * np.pi) * amplitude + mean
    return temp


def fake(client, data_type="temperature", topic="sensors/temperature"):
    if data_type == "temperature":
        data_generator = gen_temp
    elif data_type == "time":
        data_generator = gen_time

    while True:
        print("Publishing")
        if data_type == "temperature":
            client.publish(topic, gen_temp())
        elif data_type == "time":
            client.publish(topic, gen_time())
        time.sleep(2)


def on_message(client, userdata, msg):
    print(msg.topic + " " + str(msg.payload))


def on_connect(client, userdata, flags, rc):
    print("Connected with result code " + str(rc))
    if rc == 5:
        raise ConnectionError("MQTT server refused connection")


def connect_broker(server, port, username="", password=""):
    client_id = f'python-mqtt-{random.randint(0, 1000)}'
    client = mqtt.Client(client_id)
    client.on_connect = on_connect
    client.username_pw_set(username=username,
                           password=password)
    client.connect(server, port, 60)

    return client


def cli():
    parser = argparse.ArgumentParser(description='Do basic MQTT operations')
    parser.add_argument('action', choices=['sub', 'pub', 'fake'], help="")
    parser.add_argument('-t', '--topic', help="The MQTT topic")
    parser.add_argument('--type', help="The type of data to fake")
    parser.add_argument('-b', '--broker', help="Hostname of the MQTT broker")
    parser.add_argument('--port', type=int, default=1883, help="The MQTT brokers port (default: 1883)")
    parser.add_argument('-u', '--user', help="User for the MQTT broker")
    parser.add_argument('-p', '--password', help="Password of the MQTT broker")
    parser.add_argument('-d', '--payload', help="The payload to send with a set command")

    args = parser.parse_args()

    client = connect_broker(args.broker, args.port, args.user, args.password)
    if args.action == "sub":
        client.subscribe(args.topic)
        client.on_message = on_message
        client.loop_forever()
    elif args.action == "pub":
        r = client.publish(args.topic, payload=args.payload)
        print(r)
    elif args.action == "fake":
        fake(client, args.topic)


if __name__ == "__main__":
    cli()
Start the script with
python cli.py fake -t sensors/temperature -b s0.example.com -u USERNAME -p SECURE_PASSWORD`
This will fake a temperature sensor and publish the results to the MQTT topic sensors/temperature. To make sure the MQTT broker works correctly you can subscribe with
python cli.py sub -t sensors/temperature -b stats.hyteck.de -u qzt -p fisch-salz-hof
Now let’s display this data in Grafana. Add a new dashboard and then use Add->Visualization.
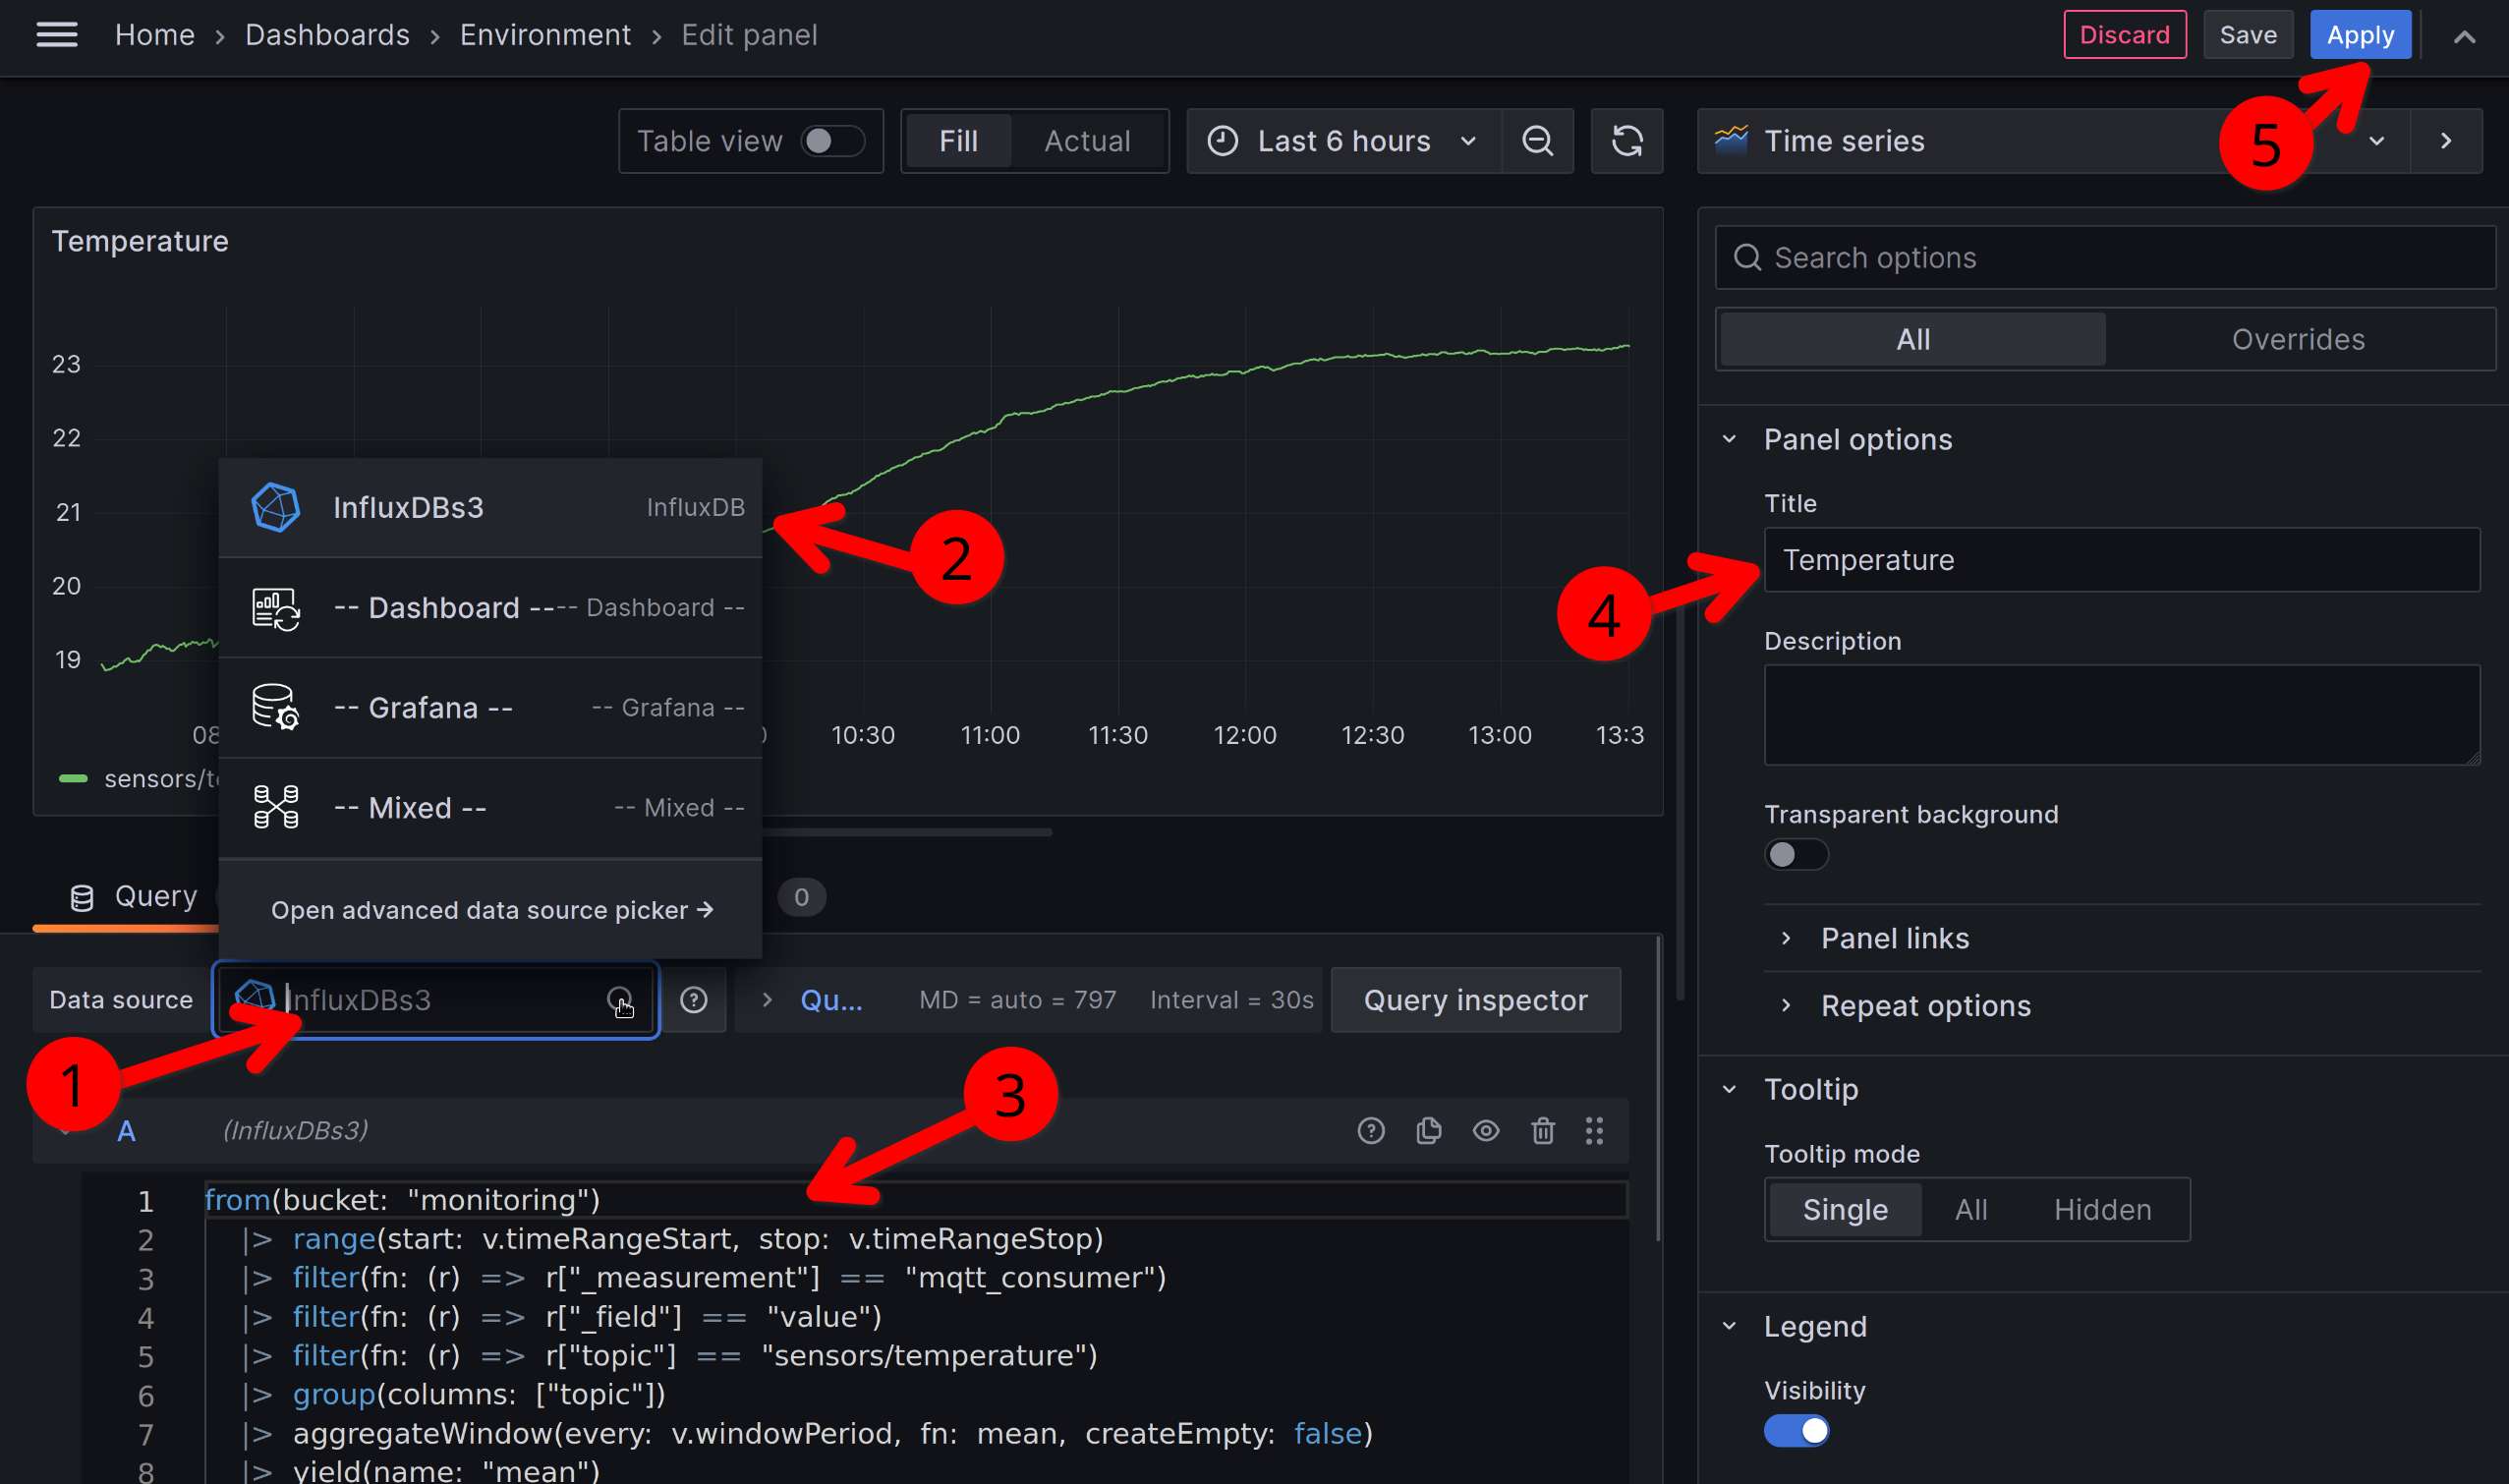 In the panel select InfluxDB as datasource (1+2) put in the folowing query (3).
from(bucket: "monitoring")
  |> range(start: v.timeRangeStart, stop: v.timeRangeStop)
  |> filter(fn: (r) => r["_measurement"] == "mqtt_consumer")
  |> filter(fn: (r) => r["_field"] == "value")
  |> filter(fn: (r) => r["topic"] == "sensors/temperature")
  |> group(columns: ["topic"])
  |> aggregateWindow(every: v.windowPeriod, fn: mean, createEmpty: false)
  |> yield(name: "mean")
add a nice title (4) and apply to see tha data (5). You should now have a nice display of your fake sensor!
Some last words
Please let me know when you follow this guide - wheter sucessful or not! I would love to improve it.
I know this seems like a lot of effort to get a few numbers to display a few numbers nicely. On the other hands, once set up this setup can do a lot of stuff, from monitoring, to alerting. Upgrades should be taken care of by MASH, check out how to do that here. Also setting up more services is a breeze. Either check the list of existing services, or add a new role to the playbook. If you don’t know how, I am happy to help!
So make sure to follow my RSS feed or any of my socials to get notified when Part 2 comes around.
Troubleshooting
When something doesn’t work feel free to
Consult the docs